
The disparity in vaccination numbers between Highland County and Ohio and Highland County continued to rise in both the “vaccine started” and “vaccine completed” categories.
The state average for “vaccine started” is 39.09 percent, which is significantly more than the Highland County average, which is 24.37 percent of the county’s population.
In terms of completed vaccines, the state average is 30.35 percent, whereas the Highland County average is 20.45 percent.
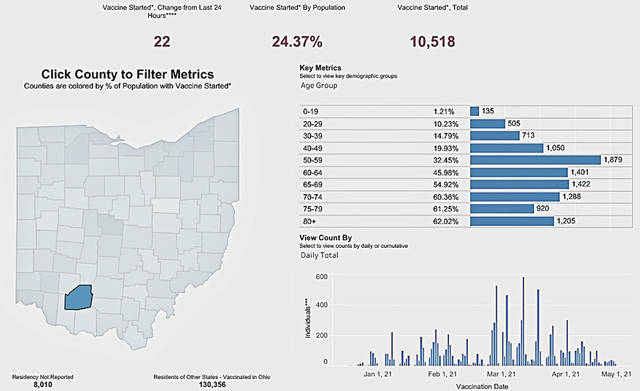
According to the Ohio Department of Health COVID-19 Vaccination Dashboard on Monday, 24.37 percent of the population in Highland County has started its vaccinations, equaling 10,518 people. The ODH considers started as “when an individual has received at least one valid dose of COVID-19 vaccine.”
The dashboard lists the following COVID-19 figures for various age groups in Highland County:
* 0-19 — 135 people, or 1.21 percent, have started their vaccines.
* 20-29 — 505 people, or 10.23 percent, have started their vaccines.
* 30-39 — 713 people, or 14.79 percent, have started their vaccines.
* 40-49 — 1,050 people, or 19.93 percent, have started their vaccines.
* 50-59 — 1,879 people, or 32.45 percent, have started their vaccines.
* 60-64 — 1,401 people, or 45.98 percent, have started their vaccines.
* 65-69 — 1,422 people, or 54.92 percent, have started their vaccines.
* 70-74 — 1,288 people, or 60.36 percent, have started their vaccines.
* 75-79 — 920 people, or 61.25 percent, have started their vaccines.
* 80 and over — 1,205 people, or 62.02 percent, have started their vaccines.
According to the dashboard, 20.45 percent of the population in Highland County has completed its vaccinations, equaling 8,828 people. The ODH considers completed when “an individual has received all recommended COVID-19 vaccine doses and is considered fully immunized.”
The dashboard lists the following COVID-19 figures for various age groups in Highland County:
* 0-19 — 60 people, or 0.54 percent, have completed their vaccines.
* 20-29 — 307 people, or 6.22 percent, have completed their vaccines.
* 30-39 — 504 people, or 10.45 percent, have completed their vaccines.
* 40-49 — 798 people, or 15.15 percent, have completed their vaccines.
* 50-59 — 1,533 people, or 26.47 percent, have completed their vaccines.
* 60-64 — 1,223 people, or 40.14 percent, have completed their vaccines.
* 65-69 — 1,248 people, or 48.20 percent, have completed their vaccines.
* 70-74 — 1,161 people, or 54.40 percent, have completed their vaccines.
* 75-79 — 864 people, or 57.52 percent, have completed their vaccines.
* 80 and over — 1,130 people, or 58.16 percent, have completed their vaccines.
According to the dashboard on Monday, 39.2 percent of the Ohio population has started its vaccinations, equaling 4,581,652 people.
The dashboard lists the following COVID-19 figures for various age groups in Ohio:
* 0-19 — 143,151 people, or 4.96 percent, have started their vaccines.
* 20-29 — 446,140 people, or 28.73 percent, have started their vaccines.
* 30-39 — 533,805 people, or 36.14 percent, have started their vaccines.
* 40-49 — 599,069 people, or 43.19 percent, have started their vaccines.
* 50-59 — 801,978 people, or 52.01 percent, have started their vaccines.
* 60-64 — 507,673 people, or 63.74 percent, have started their vaccines.
* 65-69 — 490,869 people, or 73.61 percent, have started their vaccines.
* 70-74 — 412,009 people, or 78.87 percent, have started their vaccines.
* 75-79 — 272,355 people, or 76.16 percent, have started their vaccines.
* 80 and over — 374,603 people, or 75.00 percent, have started their vaccines.
According to the dashboard, 30.35 percent of the population in Ohio has completed its vaccinations, equaling 3,547,432 people.
The dashboard lists the following COVID-19 figures for various age groups in Ohio:
* 0-19 — 56,578 people, or 1.96 percent, have completed their vaccines.
* 20-29 — 260,339 people, or 16.76 percent, have completed their vaccines.
* 30-39 — 338,402 people, or 22.91 percent, have completed their vaccines.
* 40-49 — 432,177 people, or 31.15 percent, have completed their vaccines.
* 50-59 — 630,995 people, or 40.92 percent, have completed their vaccines.
* 60-64 — 424,897 people, or 53.35 percent, have completed their vaccines.
* 65-69 — 435,643 people, or 65.33 percent, have completed their vaccines.
* 70-74 — 373,696 people, or 71.54 percent, have completed their vaccines.
* 75-79 — 248,868 people, or 69.60 percent, have completed their vaccines.
* 80 and over — 345,837 people, or 69.24 percent, have completed their vaccines.
According to the dashboard, since the pandemic began Highland County has had 3,494 total COVID-19 cases, 189 hospitalizations, 60 deaths and 3,366 presumed recovered from the virus.
Reach Jacob Clary at 937-402-2570.

