
COVID-19 is at its lowest case rate in Highland County since last summer and the beginning of the pandemic, according to The New York Times COVID-19 Tracker last updated on Thursday.
The tracker said that Highland County’s daily average for cases is at one and that the county had zero new cases. The last time the county saw zero new cases, according to this tracker, was on July 7, 2021.
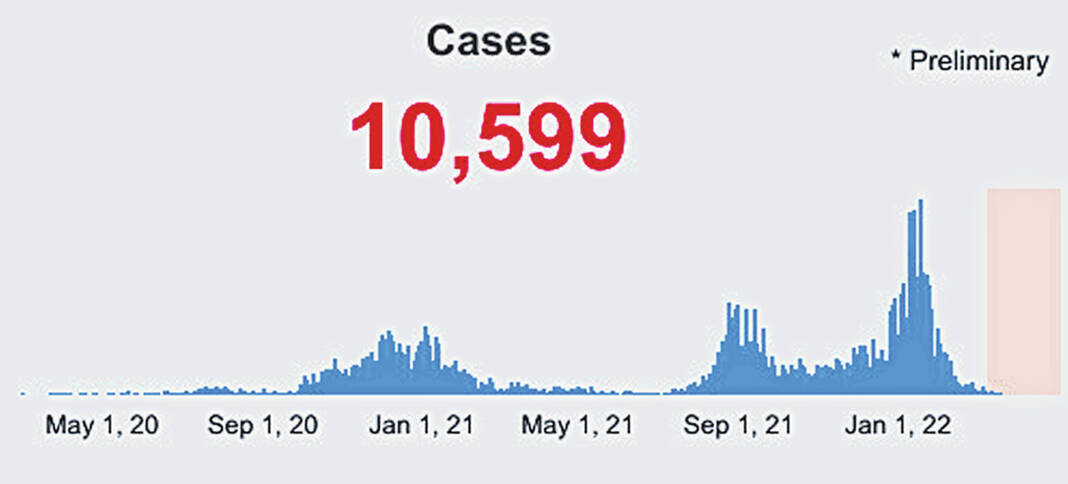
Highland County has seen a total of 10,599 cases of COVID-19 and 178 deaths from the virus, according to the Ohio Department of Health COVID-19 Dashboard.
With COVID-19 numbers as low as they are, a timeline of COVID-19 in the county gives a sense of previous years and how those years could give a glimpse of the future. All of the following statistics are according to The New York Times COVID-19 Tracker.
The tracker said that the first case of COVID-19 registered in Highland County came on March 24, 2020. However, the Daily Average didn’t pass one new case per day until May 17, 2020.
The first notable spike started on July 13, 2020, and ended on Aug. 16, 2020, with the highest daily average at five new cases per day on Aug. 2, 2021, to Aug. 6, 2021.
The county saw a slight lull in large numbers until the start of a bigger spike on Oct. 2, 2020, which lasted until May 20, 2021. This bigger spike had multiple spikes within it, which occurred on Dec. 10, 2020, and Jan. 9, 2021, where the daily average case number was 35.
The county didn’t see any sizable numbers until July 13, 2021, which was the start of the biggest spike of the entire pandemic for the Highland County and is just now coming to an end. In this big spike, there was a first, smaller spike that looked like it was coming down on Oct. 17, 2021, when the daily average dropped to 15 cases per day. This first spike had a high of 59 cases per day on Sept. 2, 2021.
The next and biggest spike of the pandemic spike started to appear in the county on Nov. 3, 2021, and ran until Feb. 25, 2022. The height of this spike came on Jan. 20, 2022, when the daily average was 138 cases per day. Following that spike, there was a precipitous fall-off and the case rate started to fall to it where it is now.
Reach Jacob Clary at 937-402-2570.

